877-401-1897
Buy Q
Features
Use Cases
OBJECTIVES
Automatic Updating
New Product Development
Tracking Analysis
PowerPoint Reporting
Customer Feedback
Data Visualization
Segmentation
OBJECTIVES
Brand Analytics
Pricing Research
Survey Analysis
Data Stories
Advertising Research
Data Cleaning
TECHNIQUES
Driver Analysis
Statistical testing
Factor Analysis
Regression
Correspondence Analysis
Cluster & Latent Class
TECHNIQUES
Text Analysis
MaxDiff
Conjoint
Crosstabs
TURF
Weighting
Pricing
Customers
Reviews
Customer Stories
Resources
LEARN
Blog
eBooks
Webinars
Market Research Guide
The Data Story Academy
The Data Story Guide
SUPPORT
Q Help Guide
Support
Hire a Researcher
FEATURED READ
How to Fit a Structural Equation Model in Q
Get the blog
ss
Free Trial
Book demo
877-401-1897
Contact
Buy Q
Free Trial
Book demo
877-401-1897
Blog
Categories
All
Advanced Analysis Techniques
Choice Modeling/Conjoint Analysis
Dimension Reduction
Correspondence Analysis
Principal Component Analysis
MaxDiff
Regression
Driver Analysis
Segmentation
Cluster Analysis
Latent Class Analysis
Text Analysis
Market Research Topics
Using Q
Beginner's Guide
Filtering
How To
Reporting/Exporting
Troubleshooting Common Issues
Using R/JavaScript
JavaScript
R
Visualizations
SUBSCRIBE
Keep updated with the latest in data science.
Search our blog
Advanced Analysis Techniques
Choice Modeling/Conjoint Analysis
Dimension Reduction
Correspondence Analysis
Principal Component Analysis
MaxDiff
Regression
Driver Analysis
Segmentation
Cluster Analysis
Latent Class Analysis
Text Analysis
Market Research Topics
Using Q
Beginner's Guide
Filtering
How To
Reporting/Exporting
Troubleshooting Common Issues
Using R/JavaScript
JavaScript
R
Visualizations
Using R/JavaScript.
How To
|
R
|
Using Q
|
Using R/JavaScript
How to Fit a Structural Equation Model in Q
by Tim Bock
How To
|
JavaScript
|
Using Q
|
Using R/JavaScript
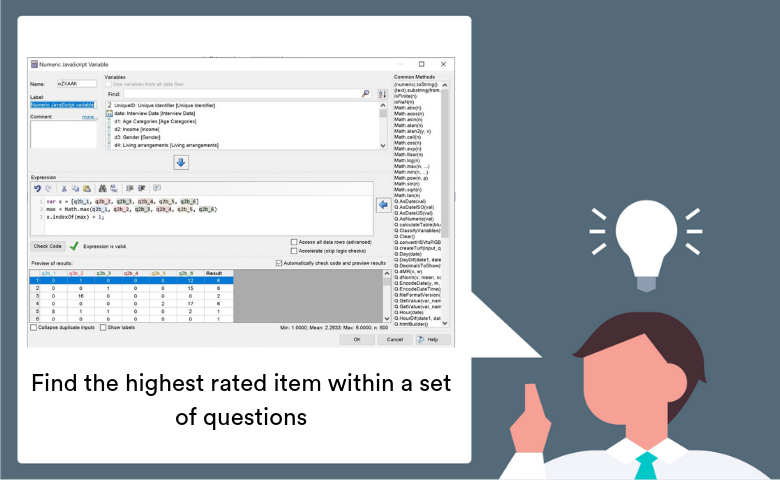
How to find the highest rated item within a set of questions
by Kris Tonthat
How To
|
R
|
Using Q
|
Using R/JavaScript
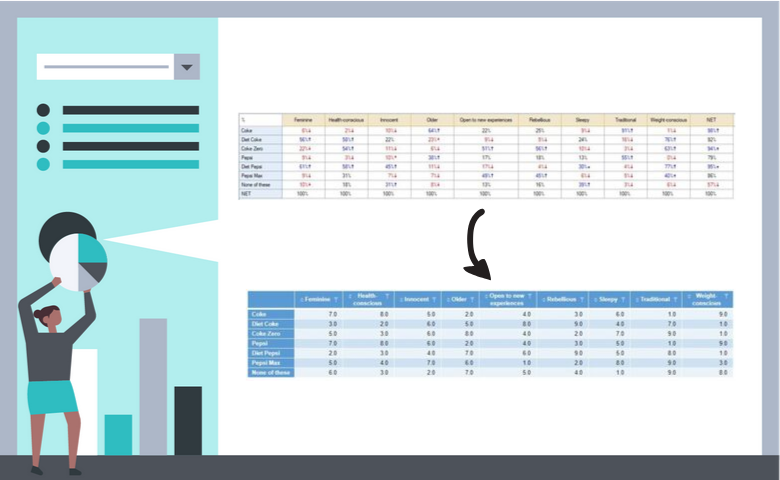
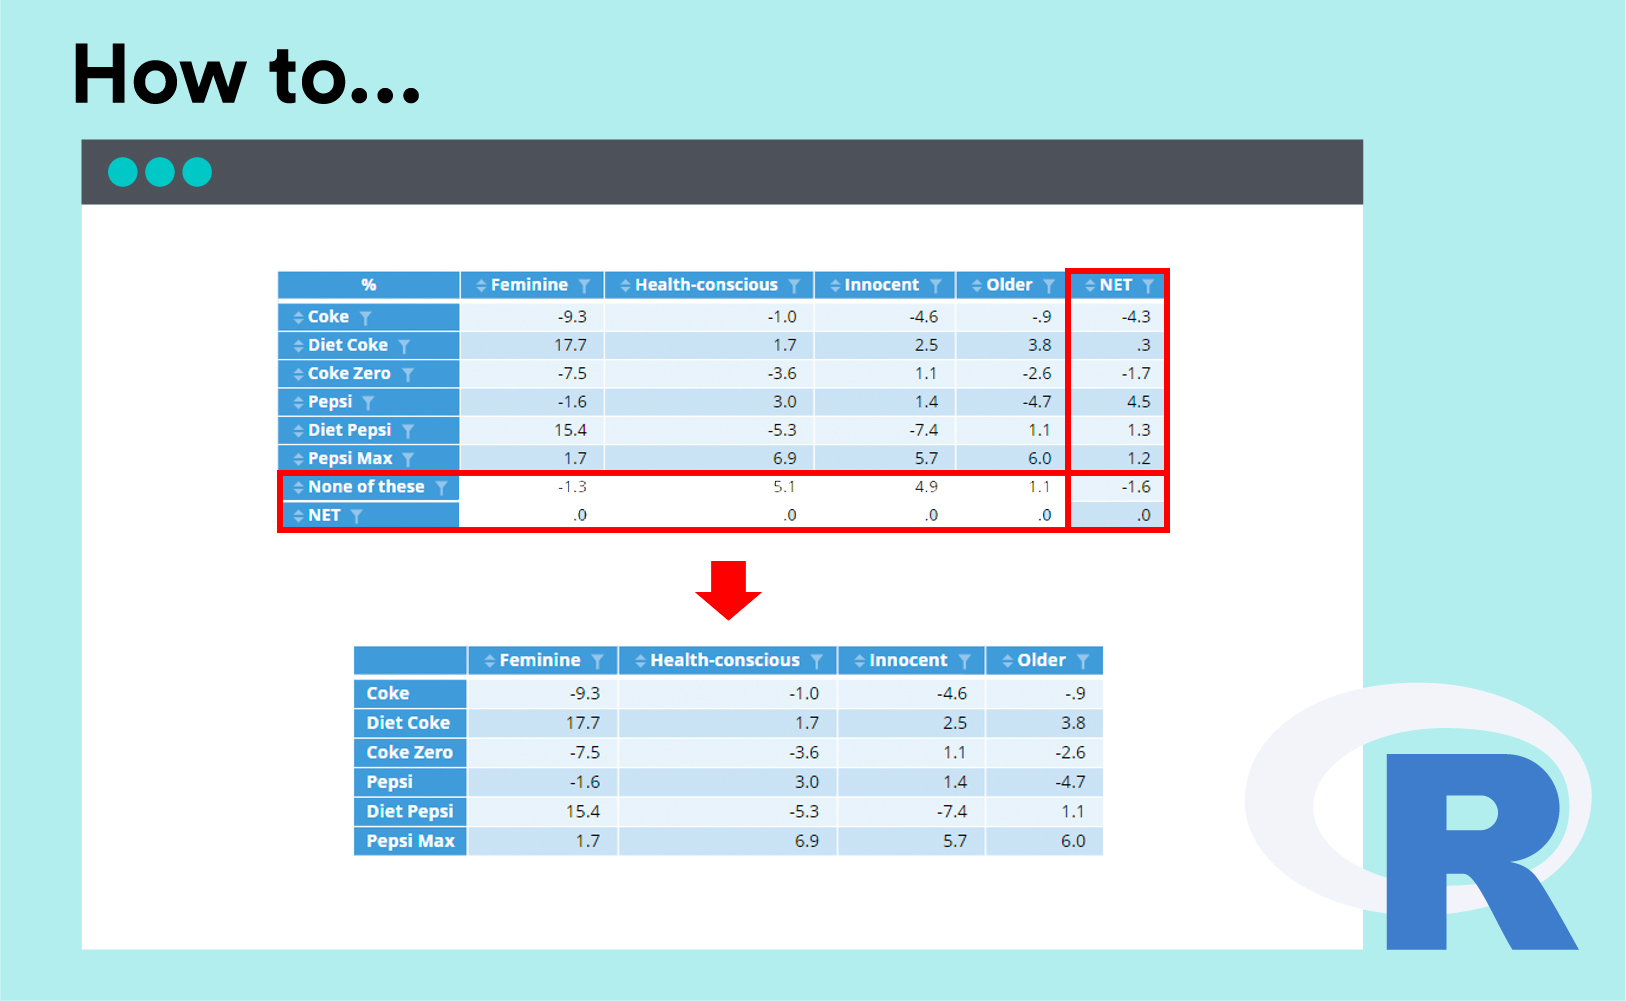
How to create a table of ranks from a crosstab
by Kris Tonthat
How To
|
R
|
Using Q
|
Using R/JavaScript
How to Remove a Row or Column using R in Q
by Matt Steele
Filtering
|
How To
|
JavaScript
|
R
|
Using Q
|
Using R/JavaScript
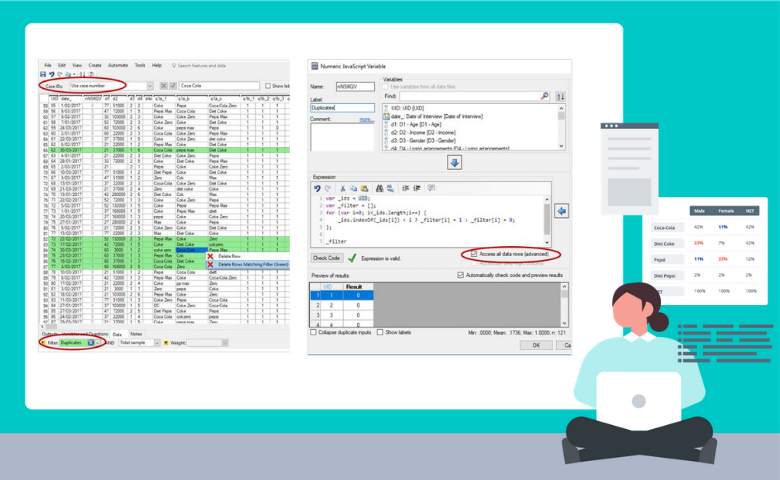
How to Identify Duplicates in Q Using Code
by Oliver Harrison
How To
|
JavaScript
|
Using Q
|
Using R/JavaScript
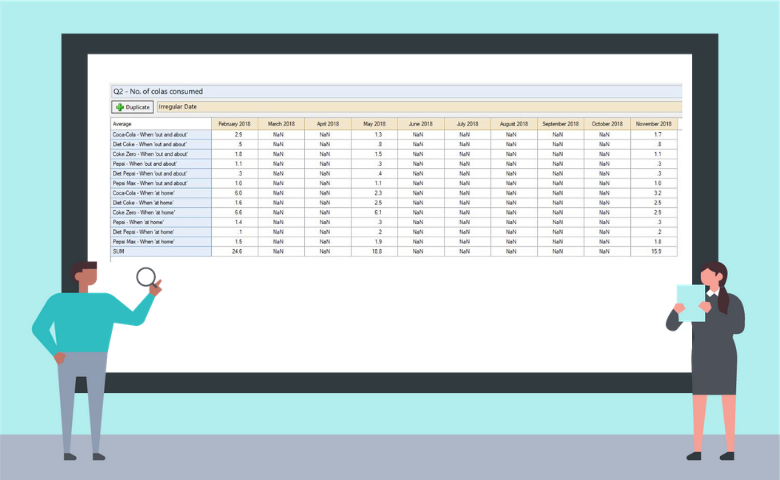
How to compare previous periods using an unequal categorical variable
by Kris Tonthat
How To
|
R
|
Using Q
|
Using R/JavaScript
How to Convert Dates into Different Time Zones in Q
by Oliver Harrison
How To
|
R
|
Using Q
|
Using R/JavaScript
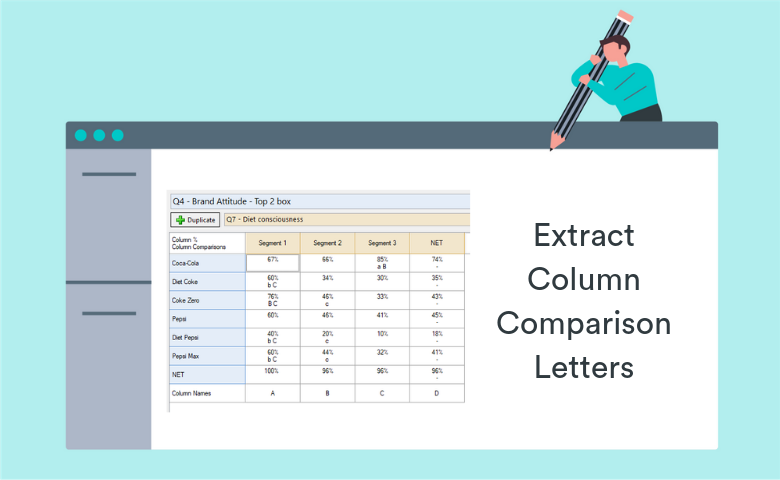
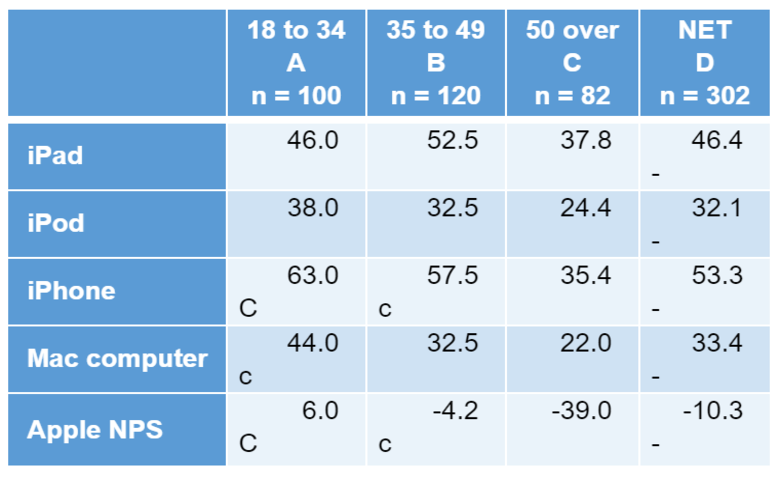
How to Extract Column Comparison Letters into a Table Automatically in Q using R
by Matt Steele
How To
|
R
|
Using Q
|
Using R/JavaScript
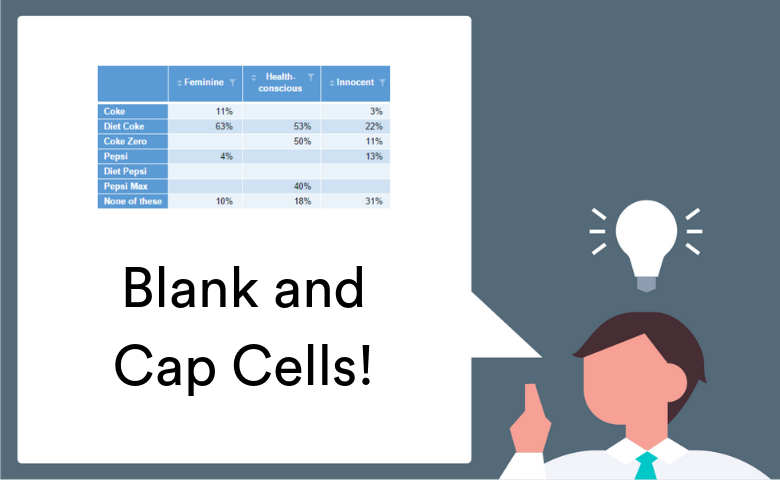
How to Blank and Cap Cells of Tables Using R in Q
by Matt Steele
How To
|
R
|
Using Q
|
Using R/JavaScript
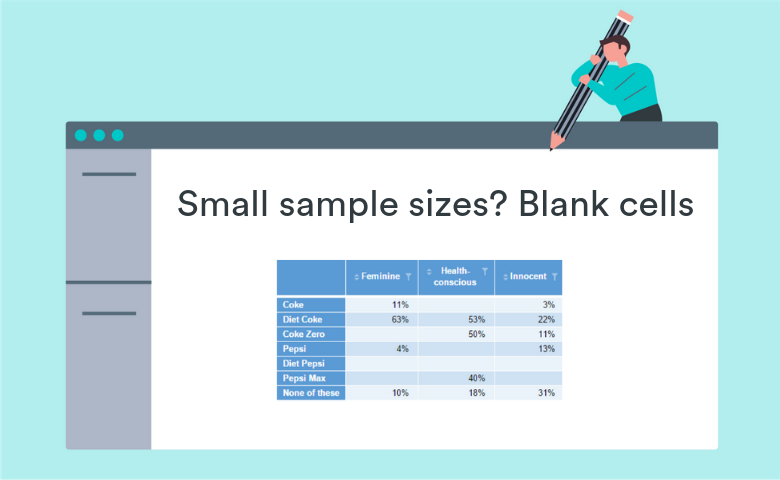
How to Blank Cells with Small Sample Sizes using R in Q
by Matt Steele
How To
|
R
|
Using Q
|
Using R/JavaScript
How to Build a Brand Funnel in Q using R
by Matt Steele
JavaScript
|
Troubleshooting Common Issues
|
Using Q
|
Using R/JavaScript
Calculating the Duration Between Two Dates
by Mattias Engdahl
Advanced Analysis Techniques
|
Choice Modeling/Conjoint Analysis
|
R
|
Using R/JavaScript
|
Visualizations
Using Substitution Maps to Understand Preferences in Conjoint Analysis
by Tim Bock
Advanced Analysis Techniques
|
Choice Modeling/Conjoint Analysis
|
R
|
Using R/JavaScript
|
Visualizations
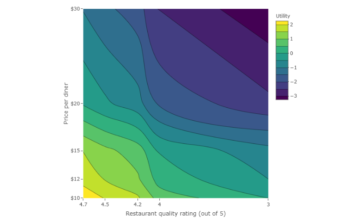
Using Indifference Curves to Understand Trade-offs in Conjoint Analysis
by Tim Bock
How To
|
R
|
Troubleshooting Common Issues
|
Using Q
|
Using R/JavaScript
How to Relabel Rows and Columns of Tables using R in Q
by Matt Steele
How To
|
R
|
Using Q
|
Using R/JavaScript
How to Sort Your Data using R in Q
by Matt Steele
How To
|
JavaScript
|
Using Q
|
Using R/JavaScript
How to Select a Random Sample in Q
by Oliver Harrison
JavaScript
|
Troubleshooting Common Issues
|
Using Q
|
Using R/JavaScript
Tips for Recoding Missing Values in Q
by Matt Steele
JavaScript
|
Troubleshooting Common Issues
|
Using Q
|
Using R/JavaScript
Comparing your Results to the Previous Period in Q
by Matt Steele
How To
|
R
|
Reporting/Exporting
|
Using Q
|
Using R/JavaScript
How to Export Updatable Text to PowerPoint from Q
by Chris Facer
How To
|
R
|
Using Q
|
Using R/JavaScript
Simple Web Scraping in Q Using R
by Chris Facer
How To
|
R
|
Using Q
|
Using R/JavaScript
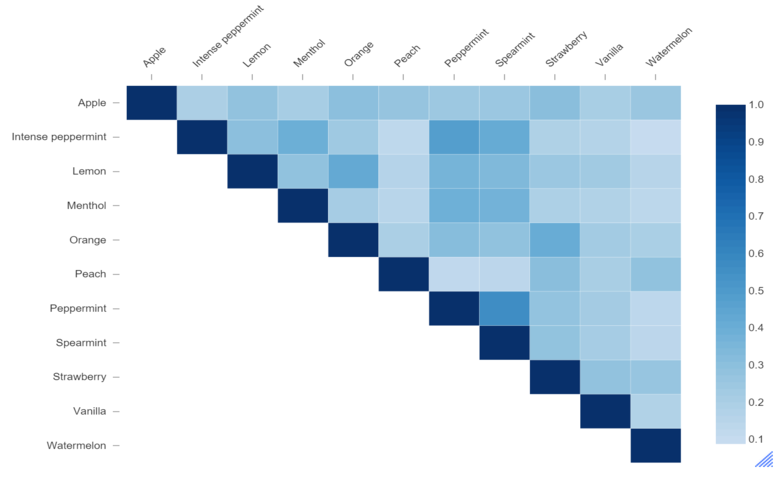
How to Calculate Jaccard Coefficients in Q Using R
by Chris Facer
R
|
Using R/JavaScript
Geocoding IP addresses in Q
by Kris Tonthat
How To
|
R
|
Using Q
|
Using R/JavaScript
How to Combine Complicated Tables in Q Using R
by Chris Facer
Advanced Analysis Techniques
|
How To
|
JavaScript
|
R
|
Text Analysis
|
Using Q
|
Using R/JavaScript
How to Split Text Strings in Q
by Daren Jackson
How To
|
JavaScript
|
R
|
Using Q
|
Using R/JavaScript
How to Convert Timestamps into Numerical Values in Q
by Daren Jackson
How To
|
R
|
Using Q
|
Using R/JavaScript
How to Calculate Penalty Analysis in Q
by Chris Facer
How To
|
R
|
Using Q
|
Using R/JavaScript
How to Aggregate Data in Q
by Jake Hoare
Beginner's Guide
|
How To
|
R
|
Using Q
|
Using R/JavaScript
How to Read Stata DTA Files into Q
by Carmen Chan
Beginner's Guide
|
R
|
Troubleshooting Common Issues
|
Using Q
|
Using R/JavaScript
How to read an Excel file into Q
by Carmen Chan
Beginner's Guide
|
JavaScript
|
Troubleshooting Common Issues
|
Using Q
|
Using R/JavaScript
Tutorial: Creating and Working with JavaScript Variables in Q
by Matt Steele
How To
|
R
|
Troubleshooting Common Issues
|
Using Q
|
Using R/JavaScript
How to Do Simple Table Manipulations With R in Q
by Matt Steele
JavaScript
|
Troubleshooting Common Issues
|
Using Q
|
Using R/JavaScript
Tips for Handling Duplicate Cases in Survey Data
by Tim Ali
Advanced Analysis Techniques
|
How To
|
R
|
Text Analysis
|
Using Q
|
Using R/JavaScript
How to Show Sentiment in Word Clouds using Q
by Tim Bock
Advanced Analysis Techniques
|
Correspondence Analysis
|
Dimension Reduction
|
R
|
Using R/JavaScript
|
Visualizations
Customization of Bubble Charts for Correspondence Analysis in Q
by Tim Bock
Advanced Analysis Techniques
|
Driver Analysis
|
R
|
Regression
|
Using R/JavaScript
Using Partial Least Squares to conduct relative importance analysis in Q
by Jake Hoare
Advanced Analysis Techniques
|
Cluster Analysis
|
How To
|
Latent Class Analysis
|
R
|
Segmentation
|
Using Q
|
Using R/JavaScript
Assigning Respondents to Clusters/Segments in New Data Files in Q
by Tim Bock
Contact
X
First name
*
Last name
*
Company
*
Email address
*
Message
*
Cookies help us provide, protect and improve our products and services. By using our website, you agree to our use of cookies (
privacy policy
).
Register now