877-401-1897
Buy Q
Features
Use Cases
OBJECTIVES
Automatic Updating
New Product Development
Tracking Analysis
PowerPoint Reporting
Customer Feedback
Data Visualization
Segmentation
OBJECTIVES
Brand Analytics
Pricing Research
Survey Analysis
Data Stories
Advertising Research
Data Cleaning
TECHNIQUES
Driver Analysis
Statistical testing
Factor Analysis
Regression
Correspondence Analysis
Cluster & Latent Class
TECHNIQUES
Text Analysis
MaxDiff
Conjoint
Crosstabs
TURF
Weighting
Pricing
Customers
Reviews
Customer Stories
Resources
LEARN
Blog
eBooks
Webinars
Market Research Guide
The Data Story Academy
The Data Story Guide
SUPPORT
Q Help Guide
Support
Hire a Researcher
FEATURED READ
How to Fit a Structural Equation Model in Q
Get the blog
ss
Free Trial
Book demo
877-401-1897
Contact
Buy Q
Free Trial
Book demo
877-401-1897
Blog
Categories
All
Advanced Analysis Techniques
Choice Modeling/Conjoint Analysis
Dimension Reduction
Correspondence Analysis
Principal Component Analysis
MaxDiff
Regression
Driver Analysis
Segmentation
Cluster Analysis
Latent Class Analysis
Text Analysis
Market Research Topics
Using Q
Beginner's Guide
Filtering
How To
Reporting/Exporting
Troubleshooting Common Issues
Using R/JavaScript
JavaScript
R
Visualizations
SUBSCRIBE
Keep updated with the latest in data science.
Search our blog
Advanced Analysis Techniques
Choice Modeling/Conjoint Analysis
Dimension Reduction
Correspondence Analysis
Principal Component Analysis
MaxDiff
Regression
Driver Analysis
Segmentation
Cluster Analysis
Latent Class Analysis
Text Analysis
Market Research Topics
Using Q
Beginner's Guide
Filtering
How To
Reporting/Exporting
Troubleshooting Common Issues
Using R/JavaScript
JavaScript
R
Visualizations
Troubleshooting Common Issues.
How To
|
Troubleshooting Common Issues
|
Using Q
How to set Value Attributes for a Pick Any and Pick Any-Grid
by Elizabeth Kucko
Troubleshooting Common Issues
|
Using Q
Channel Q – Episodes 1 & 2 – Q&A on Brand Tracking
by Matt Munley
How To
|
Troubleshooting Common Issues
|
Using Q
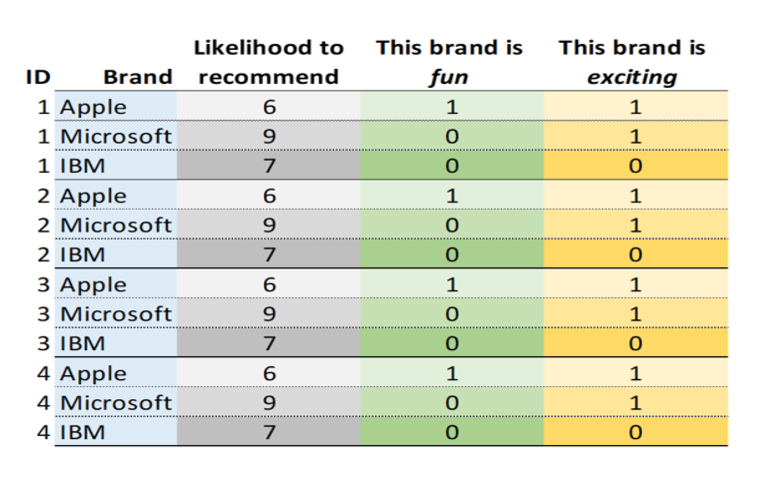
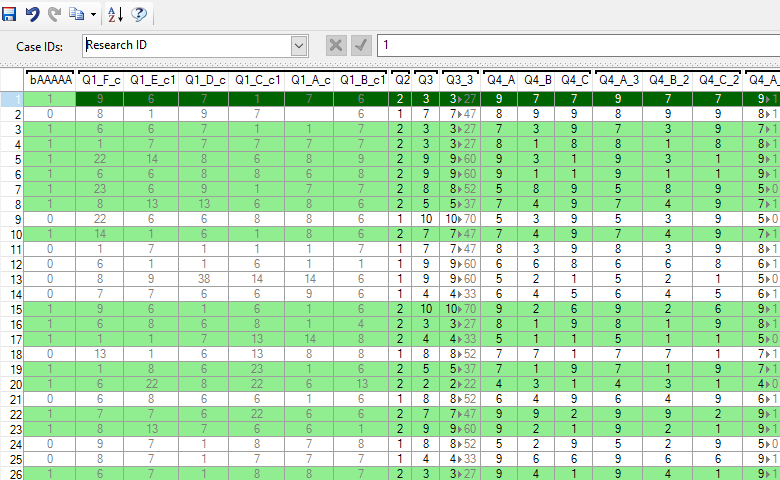
How to Combine Separate Questions into a Grid in Q
by Elizabeth Kucko
Beginner's Guide
|
Troubleshooting Common Issues
|
Using Q
Your Guide to Using Built-in Mathematical Functions in Q
by Tim Ali
Market Research Topics
|
Troubleshooting Common Issues
|
Using Q
Understanding the Sample Size in Multiple Response Questions
by Chris Facer
How To
|
Troubleshooting Common Issues
|
Using Q
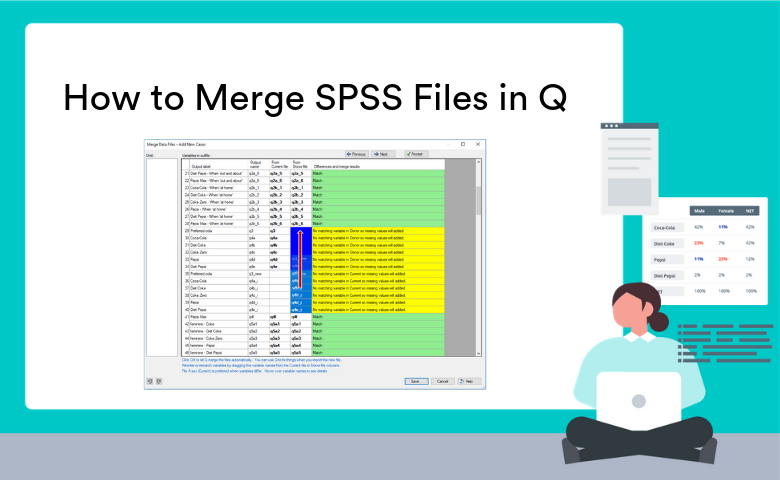
How to Merge SPSS Files in Q
by Chris Facer
How To
|
Troubleshooting Common Issues
|
Using Q
|
Visualizations
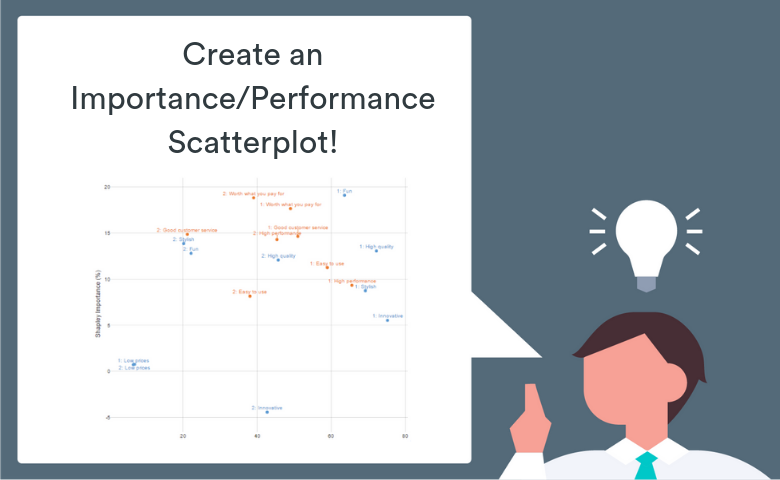
How to Make an Importance/Performance Scatterplot in Q
by Matt Steele
JavaScript
|
Troubleshooting Common Issues
|
Using Q
|
Using R/JavaScript
Calculating the Duration Between Two Dates
by Mattias Engdahl
Troubleshooting Common Issues
|
Using Q
|
Visualizations
3 Ways to Quickly Sift Through 3,050 Crosstabs and Find the Magic One
by Tim Bock
Troubleshooting Common Issues
|
Using Q
Tips for Merging Questions in Q Without Writing Syntax
by Oliver Harrison
How To
|
Troubleshooting Common Issues
|
Using Q
|
Visualizations
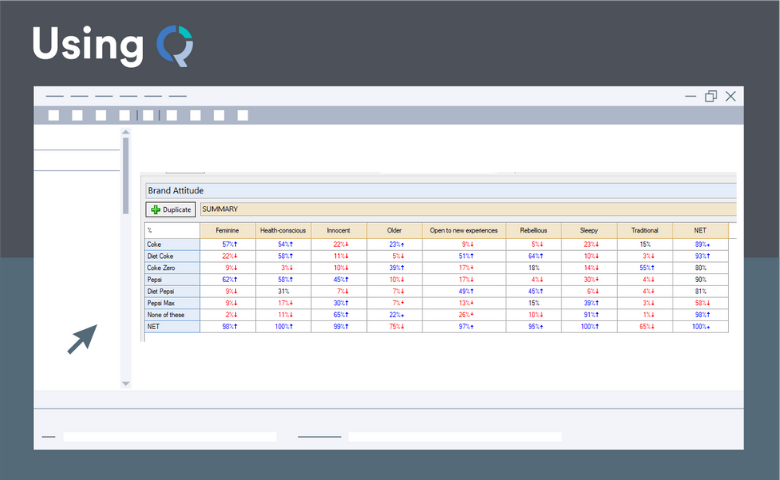
How to Quickly Sift Through 3,050 Crosstabs and Find the Important Ones in Q
by Tim Bock
Filtering
|
Troubleshooting Common Issues
|
Using Q
Tips for Rebasing and Filtering Data in Q
by Chris Facer
How To
|
Troubleshooting Common Issues
|
Using Q
Guide for Working with Excel Files in Q
by Chris Facer
Advanced Analysis Techniques
|
How To
|
Text Analysis
|
Troubleshooting Common Issues
|
Using Q
How to Reuse Code Frames in Q
by Oliver Harrison
Advanced Analysis Techniques
|
How To
|
Text Analysis
|
Troubleshooting Common Issues
|
Using Q
How to Code Other/Specify Responses in Q
by Oliver Harrison
Advanced Analysis Techniques
|
How To
|
Text Analysis
|
Troubleshooting Common Issues
|
Using Q
How to Code an Open-Ended Question into a Single Response Question in Q
by Oliver Harrison
Advanced Analysis Techniques
|
How To
|
Text Analysis
|
Troubleshooting Common Issues
|
Using Q
How to Code Open-Ended Responses with Multiple Mentions in Q
by Oliver Harrison
Advanced Analysis Techniques
|
How To
|
Text Analysis
|
Troubleshooting Common Issues
|
Using Q
How to Code an Open-Ended Question into a Multiple Response Question in Q
by Oliver Harrison
How To
|
R
|
Troubleshooting Common Issues
|
Using Q
|
Using R/JavaScript
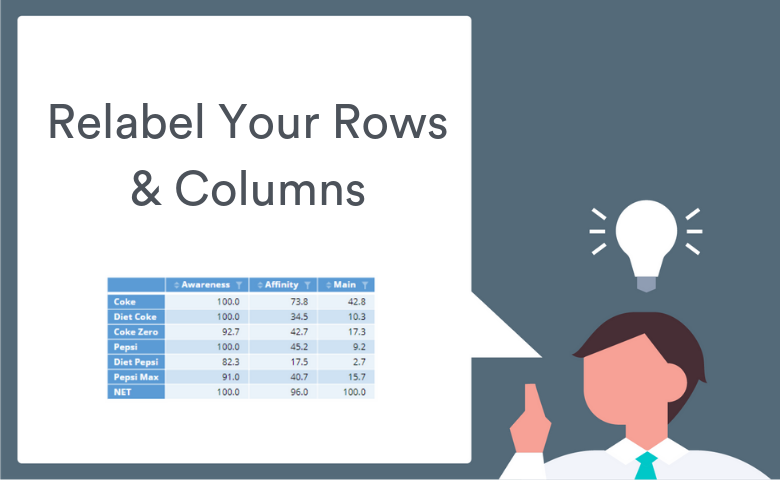
How to Relabel Rows and Columns of Tables using R in Q
by Matt Steele
Beginner's Guide
|
How To
|
Troubleshooting Common Issues
|
Using Q
How to Create a Banner in Q
by Daren Jackson
Troubleshooting Common Issues
|
Using Q
|
Visualizations
New Ways to Visualize Your Data
by Chris Facer
Beginner's Guide
|
Troubleshooting Common Issues
|
Using Q
Changing the Way Your Data Looks so You Can Do More with It
by Chris Facer
JavaScript
|
Troubleshooting Common Issues
|
Using Q
|
Using R/JavaScript
Tips for Recoding Missing Values in Q
by Matt Steele
JavaScript
|
Troubleshooting Common Issues
|
Using Q
|
Using R/JavaScript
Comparing your Results to the Previous Period in Q
by Matt Steele
Filtering
|
How To
|
Troubleshooting Common Issues
|
Using Q
How to Filter Data in Q
by Chris Facer
How To
|
Troubleshooting Common Issues
|
Using Q
How to do NPS Recoding in Q
by Daren Jackson
How To
|
Troubleshooting Common Issues
|
Using Q
How to Stack Data in Q
by Chris Facer
Beginner's Guide
|
How To
|
Troubleshooting Common Issues
|
Using Q
How to Calculate an Average Value from Categorical Data in Q
by Daren Jackson
Beginner's Guide
|
How To
|
Troubleshooting Common Issues
|
Using Q
How to Sort Data in Q
by Tim Ali
Beginner's Guide
|
How To
|
Troubleshooting Common Issues
|
Using Q
How to Create a Top 2 Box Score in Q
by Daren Jackson
Beginner's Guide
|
R
|
Troubleshooting Common Issues
|
Using Q
|
Using R/JavaScript
How to read an Excel file into Q
by Carmen Chan
Beginner's Guide
|
JavaScript
|
Troubleshooting Common Issues
|
Using Q
|
Using R/JavaScript
Tutorial: Creating and Working with JavaScript Variables in Q
by Matt Steele
How To
|
R
|
Troubleshooting Common Issues
|
Using Q
|
Using R/JavaScript
How to Do Simple Table Manipulations With R in Q
by Matt Steele
How To
|
Troubleshooting Common Issues
|
Using Q
How to Save a Modified Copy of an SPSS Data File
by Tim Ali
Troubleshooting Common Issues
|
Using Q
Tips for Working in the Data Tab
by Tim Ali
JavaScript
|
Troubleshooting Common Issues
|
Using Q
|
Using R/JavaScript
Tips for Handling Duplicate Cases in Survey Data
by Tim Ali
Contact
X
First name
*
Last name
*
Company
*
Email address
*
Message
*
Cookies help us provide, protect and improve our products and services. By using our website, you agree to our use of cookies (
privacy policy
).
Register now