How to Extract Column Comparison Letters into a Table Automatically in Q using R
In recent posts we’ve discussed how you can reference source tables using R in Q to manipulate the statistics into a new custom table. In those examples, the source table only contained one statistic (e.g. % or column-%). But what happens if you have more than one statistic in the source table?
One such example is when you want to extract the column comparison letters from a table using R. For instance, you may want to place these in a table in PowerPoint adjacent to a chart of the data. The column comparison letters are only available in the source table if you also have another statistic involved in the table. In this post, we explore how you can use R to extract statistics from a source table that contains more than one statistic.
Reference a third dimension in the source table that has multiple statistics
In previous posts, we examined how you can extract information from a source table using R. The logic is something like this:
table[rows,columns]
That works fine with one statistic in the source table. When the source table has multiple statistics per cell, these form a “third dimension” to the table. So the referencing then becomes:
table[rows,columns,statistic]
When there’s only one statistic in the source table, you don’t need to specify the third dimension (R assumes it’s 1). But when there are multiple statistics involved, each cell becomes an array of statistics. Thus, you need to tell R which number from the array you are referencing. If you get the red error message in Q – “incorrect number of dimensions” – one possible reason is that you’ve got a source table with multiple statistics per cell. R needs you to be specific as to which statistic you want to retrieve from those available.
Consider the source table below which is a crosstab. Suppose it has a reference name of t2b_seg.
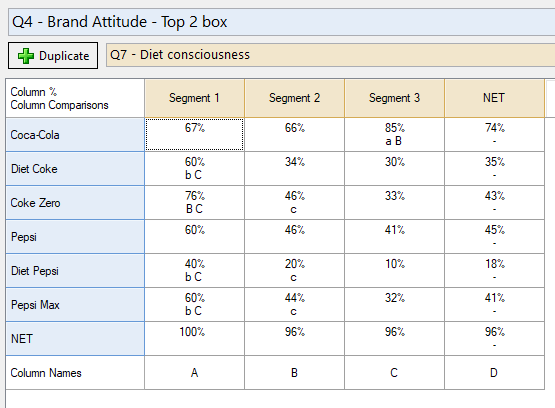
If we wanted to extract only the column comparison letters into a secondary table, all we need to do is specify we want the second statistic:
t2b_seg[,,2]
Recall that leaving a dimension blank and just using a comma references all of that dimension (i.e. all the rows and columns). Now if you didn’t want the NET rows, you could either remove or hide them from the source table. Alternatively, or you could remove them from the R Output, with this quick adjustment:
t2b_seg[-7,-4,2]
The minus 7 and minus 4 remove the 7th row and the 4th column respectively in returning the new table. There are ways to remove these rows based on row name, but that goes beyond the scope of this article. Check out posts like this to see how that can be done!
Try doing this yourself in Q
You can find the above worked example is in this QPack here.