
The Net Promoter Score (NPS) is a method for indexing a person’s willingness to recommend a product or service to others. It is defined as the share of people likely to promote a subject (“Promoters”) less the share of people likely to share negative opinions of the same subject (“Detractors”). The NPS method is applied to scaled survey questions – most commonly “likelihood” questions with 11-point scales. This post will outline the different ways that you can generate NPS scores in Q. We look at both the manual approaches, which help you understand the appropriate data setup, and also an automatic approach which will save time when you have a larger batch of NPS variables to work with.
Manual Recoding
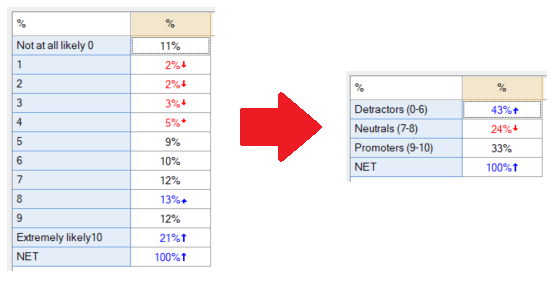
The general process for generating NPS scores is to group the responses into 3 groups (Promoters, Neutrals, and Detractors), with the difference between the Promoters and the Detractors comprising the NPS. On an 11-point scale, the 0-6 range is commonly identified as the “Detractors”, the 7-8 range is identified as the “Neutrals”, and the 9-10 range is identified as the “Promoters”. In Q, you can create the groupings by manually merging the categories on the table. This is done by dragging and dropping the row labels onto one another, or by selecting a bunch of labels with CTRL or SHIFT, and then right-clicking and selecting Merge. Categories can be renamed by right-clicking and selecting Rename.
The result is:
Subtracting the Detractors from the Promoters is a more difficult task.
A smarter way to have Q generate the same NPS scores without having to carry out any subtraction would be to recode the values for each of the response options. By right-clicking on the table and selecting Values, you can modify the values Q will use for statistical calculations. In this case, we will replace values of 0 through 6 with -100, values of 7 or 8 to 0, and values of 9 or 10 to 100. The following shows the original question’s values in the Source Value column and our recoded values in the Value column.
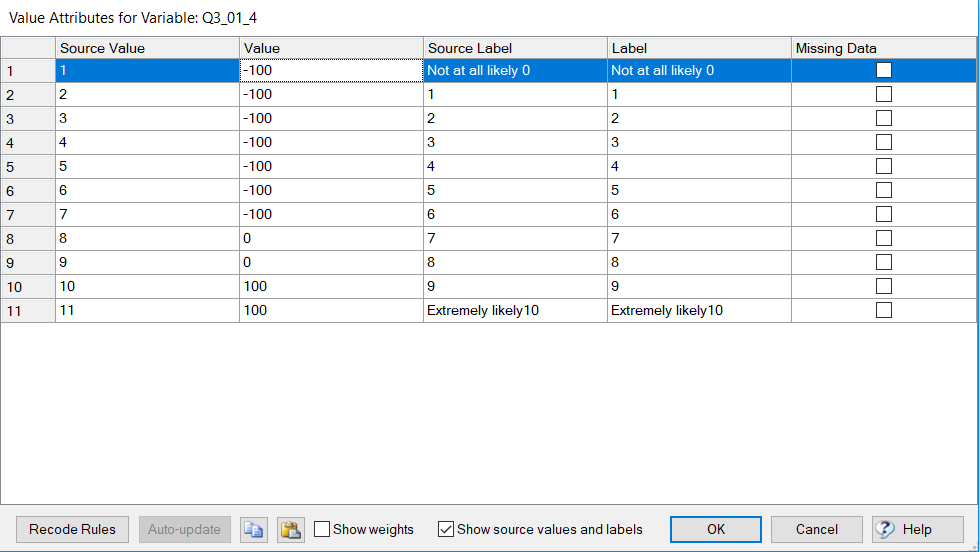
Once you have recoded the data this way, the Average of the respondent’s values will be the net promoter score. For more on why this works, see our article about the The NPS Recoding Trick.
In addition, you can go the extra step of renaming this average statistic as the NPS by going to Edit > Table Options > Output Text in the menu bar and typing NPS into the Override Text column for Average. This applies to the current table only.

Additional Applications
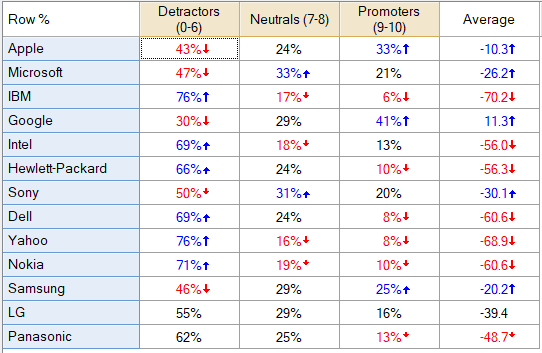
Generating NPS scores through value recoding has an added benefit of for Pick One – Multi questions. As shown below, you can see NPS scores for a battery of questions (as these questions are often listed in a battery with identical response options) all at once. This can be achieved by adding the Average statistic to either the Statistics – Below or Statistics – Right depending on the orientation of the question.
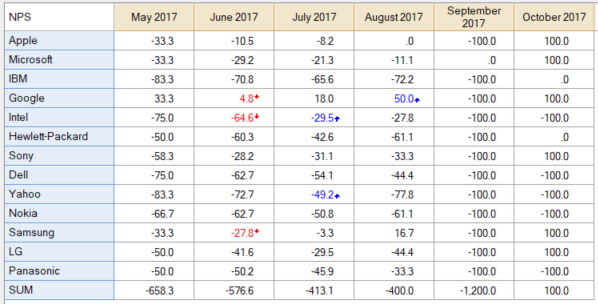
This application is also useful when trying to track NPS scores over time. By restructuring the question to be a Number – Multi instead (right click on the table and select “Question Name” > Restructure data > Averages (Number – Multi)), you can crosstab the NPS generating question against a time period question.
For more on understanding the role the Question Type setting plays in Q, see our Wiki.
Automated solution
Q can automatically perform this process on multiple questions all at once so that you avoid having to do these transformations on large lists of questions. The NPS Recoding feature can be found in the Online Library, accessed by going to Automate > Browse Online Library > Create New Variables > NPS Recoding from the menu bar. This process will look for likelihood to recommend questions in your project and create new variables that are recoded to display the NPS score. Please note: Q will only be able to recognize these questions if the words “likely” or “likelihood” are included in the question name or value labels and if the question is an 11-point scales.
The first prompt will list the questions that have been deemed eligible for the process. Use CTRL or SHIFT to select all of the tables for which you’d like to generate NPS scores and click OK. Q will then generate a new folder in your report tree with individual tables for each of the newly created NPS questions.
Ready to get started? Book a demo of Q, or read more about Q on our blog!