


Advanced Analysis Techniques | Correspondence Analysis | Dimension Reduction | R | Using R/JavaScript | Visualizations
Customization of Bubble Charts for Correspondence Analysis in Q
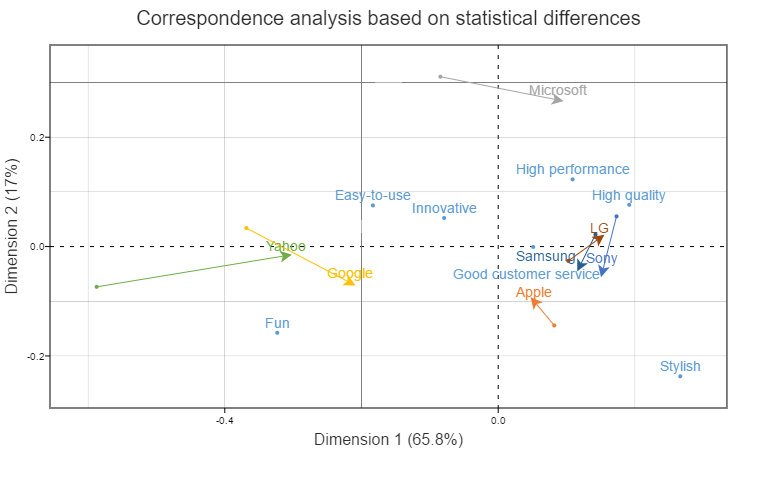
Correspondence Analysis in Q
Continue reading
Using Correspondence Analysis to Compare Sub-Groups and Understand Trends
This post shows how to use correspondence analysis to compare sub-groups. It focuses on one of the most interesting types of sub-groups: data at different points…
Continue reading
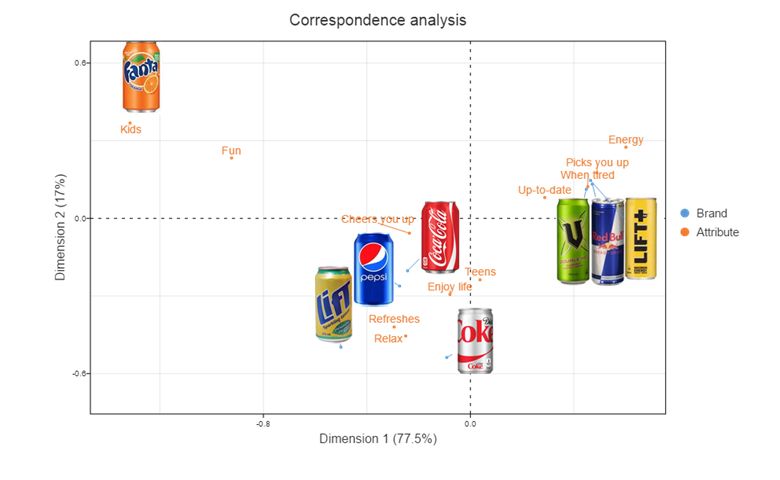
Easily Add Logos to a Correspondence Analysis Map in Q
You can take your correspondence analysis plots to the next level by including images. Here is a guide to creating them in Q.
Continue reading
