
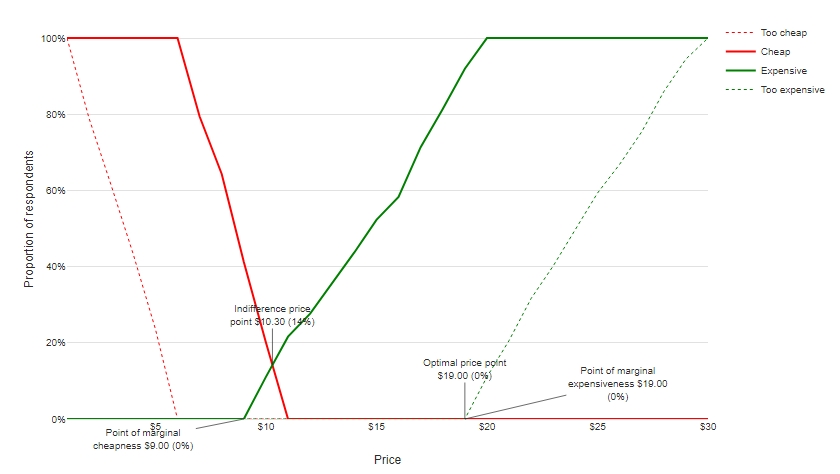
Van Westendorp analysis, common in market research, aims to find the optimal price point at which to sell a good or service. You find this point, according to Van Westendorp’s principles, at the intersection of the cumulative percentages between too inexpensive and too expensive (see Van Westendorp’s Price Sensitivity Meter). You conduct such an analysis in Q by means of a few clicks.
Setting up the Questions and the Data in Q
Van Westendorp analysis relies on the presentation of four questions to your survey respondents:
- At what price point a good or service is considered so cheap that they would doubt its quality.
- At what price point a good or service is to be considered cheap, but not cast doubt on its quality.
- At what point the respondent would consider it expensive.
- At what price point the respondent would consider it too expensive to buy.
The data should be stored in actual dollar values, so if you’ve used a single-select question, it is important to first re-code it to the dollar values that each respondent has selected. Otherwise you may have to use a bit too much imagination to interpret the resultant chart! Thus, you’re better off letting the respondent enter their own dollar value in a numeric entry style question. In Q, the variables should be formatted as numeric variables, i.e. their Question Type should be set to Number and the Variable Type should be Numeric.
Running the Analysis
To run the analysis:
- Go to Automate > Browse Online Library > Marketing > Price Sensitivity Meter.
- Under Inputs > DATA SOURCE > Price considered ‘Too cheap’ select the variable that stores your data for “too cheap”.
- Repeat step 2 for the other three variables.
- Click Calculate (or ensure that Automatic is checked).
The chart output will now be run and you should get something along these lines:
The chart’s appearance settings can be edited from the Chart tab.


