Text Coding Software – Choosing the Right Software for Your Needs

Text Coding in market research is the process of taking open-ended survey responses and categorizing them to allow for data analysis. Open-ended questions can trigger richer and deeper responses than closed-ended questions, but they can also be difficult to interpret and cumbersome to analyze.

Text coding can be a tedious and time-consuming process, but with the help of modern market research software, it is a lot less painful. That’s why you need Q!

Text Coding in Q

Q Research Software comes with state-of-the-art tools to provide you with the best possible analysis. Our software allows you to:

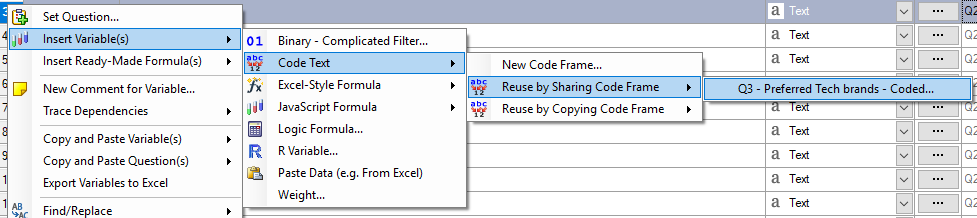
  • Copy and share response codes: Q saves response codes so you don’t have to repeat yourself.
  • Import and export code frames and names: Import existing code frames and then export for later use.
  • Potential auto-coding: Q remembers how you coded past questions and can auto-code identical responses.

Get started with Q today

Text coding software: FAQs

When should I use Text Coding?

Whenever you need to analyze or report on open-ended question responses.

What problems does Text Coding solve?

Open-ended survey questions can yield messy and unruly data. Text coding categorizes the responses from those questions, preparing them for analysis and interpretation.

What is the end-point of Text Coding?

The end-point is usually a code frame that categorizes each survey response into one or more categories. From there you can analyze the data by counting frequencies, performing sentiment analysis, and topic modeling.

What is the best Text Coding software for generating an experimental design through to analysis of the results?

Q Research Software is the easiest and most flexible tool to create a Banner Table. Book a demo today.

Get started with Q today

Get started with Q today

Not ready to chat to an expert? Download a free trial.

Start your trial

Automate the grunt work

Everything that can be automated is automated, including cleaning & formatting data, statistical testing, generating tables, updating analyses and reproducing reports.

DIY advanced analysis & visualization

Most analysis tools make statistical analysis harder than it ought to be. We have automated all the steps that usually take people years of training to learn.

Share insight-filled stories

Visualize information and design reports that make storytelling effortless with seamless Microsoft Office and Displayr integration.

“It’s fast, it’s advanced, and it does everything you want it”
Kyle Manlove, Schireson Associate
Cookies help us provide, protect and improve our products and services. By using our website, you agree to our use of cookies (privacy policy).
close-image
close-link

Register now
close-link