Brand Mapping Software – Choosing the Right Software for Your Needs
Brand mapping is the process of placing your brand in the context of the overall market. It involves comparing how your brand is positioned relative to competitors and identifying the perception attributes that are most commonly linked to you and your products. For example, a tech company may want to know which perception attributes — stylish, fun, innovative, affordable, etc. — are most commonly associated with their brand. They may also be interested in knowing which of their competitors are perceived to be most similar to them.
Representing a brand map is relatively straightforward when you are analyzing fewer than three attributes, but any more requires you to condense information from multi-dimensional data into only two dimensions. This is when you need Correspondence Analysis and Q.
How does Brand Mapping work?
A brand map is a visual depiction of your market, with your competitors and certain perception attributes included. Brands are positioned near other similar brands, attributes are positioned near other similar attributes, and with a bit of geometry, we can also determine which brands are linked to which attributes.
A Correspondence Analysis visualization is created by computing row and column averages, expected values, and residual values — but you don’t need to do any of that. With Q, simply import your data and let the software handle the rest.
Brand Mapping in Q
Q Research Software comes with state-of-the-art tools to provide you with the best possible analysis. Our software allows you to:
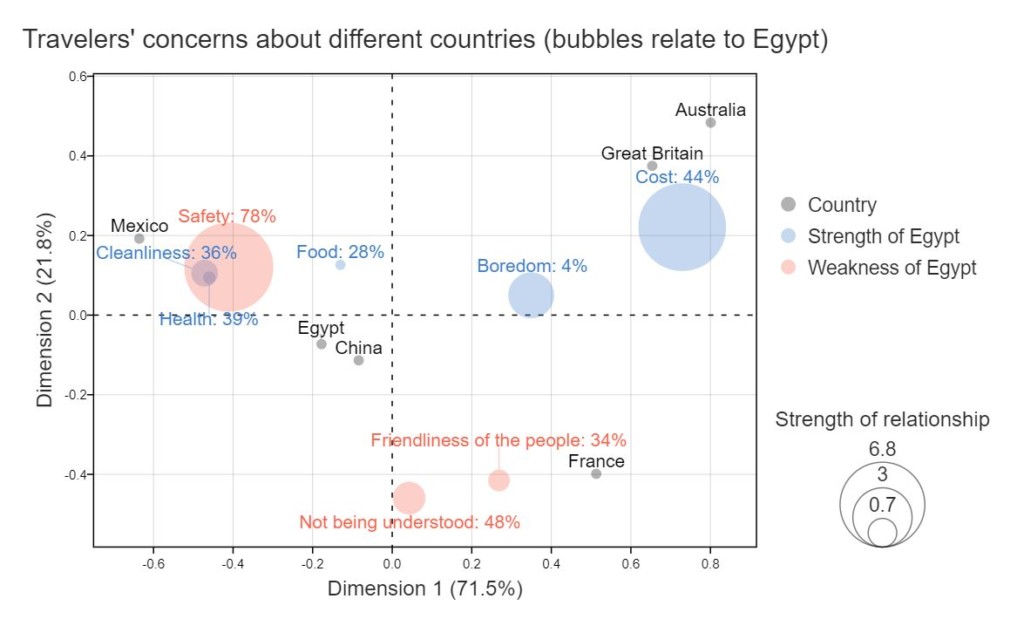
- Add a focus: Alter the Correspondence Analysis to explain 100% of the variance in your own brand, making it the centerpiece of your analysis.
- Normalization and scaling: Normalize and scale your Correspondence Analysis according to your needs.
- Bubble charts and Moon plots: Choose from a variety of different visualization formats to best represent your brand map.
- Do it all quickly and easily: No need to write code or wrangle data.