Significance Testing Software – Choosing the Right Software for Your Needs

Significance testing tells us how confident we should be in a particular result. It allows us to quantify how likely it is that our findings capture a real effect, rather than just random noise. For example, let’s say a customer satisfaction survey finds that female customers are slightly more satisfied than male customers. How do we know whether the difference is noteworthy?

To answer that question, we need significance testing.

Statistical Testing in Q

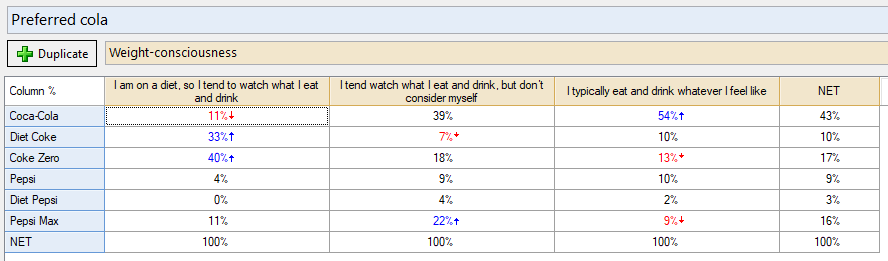
Q automates a lot of the significance testing for you. Results that are significantly high are highlighted in blue, and those that are significantly low are marked in red. Q automatically chooses the most appropriate significance test based on the data you have selected. There’s no need to calculate standard errors, confidence intervals, or t-values — all that is computed behind the scenes.

Q Research Software comes with state-of-the-art significance testing tools:

  • Effective sample size adjustments for weights to all tests
  • Customizable significance level cut-offs
  • False discovery rates
  • t-tests with equal and unequal variances

Get started with Q today

Significance testing software: FAQs

When should I use significance tests?

Any time you want to test whether a trend, outlier, or interesting detail in your data set is noteworthy. There is always a chance that these findings are the result of sampling error or pure coincidence, and a significance test allows you to determine how confident you should be that the result captures a real effect.

What problems does significance testing solve?

It takes the guesswork out of determining which results to focus on and which to disregard. We can quantify our confidence in a result through a significance test.

What is the end-point of significance testing?

Significance testing usually produces a p-value or confidence interval. A p-value indicates the probability that a result is significant, and a confidence interval provides a range for where the true result lies.

What is the best statistical testing software for generating an experimental design through to analysis of the results?

Q Research Software is the easiest and most flexible tool for significance testing. Book a demo today.

Get started with Q today

Get started with Q today

Not ready to chat to an expert? Download a free trial.

Start your trial

Automate the grunt work

Everything that can be automated is automated, including cleaning & formatting data, statistical testing, generating tables, updating analyses and reproducing reports.

DIY advanced analysis & visualization

Most analysis tools make statistical analysis harder than it ought to be. We have automated all the steps that usually take people years of training to learn.

Share insight-filled stories

Visualize information and design reports that make storytelling effortless with seamless Microsoft Office and Displayr integration.

“It’s fast, it’s advanced, and it does everything you want it”
Kyle Manlove, Schireson Associate
Cookies help us provide, protect and improve our products and services. By using our website, you agree to our use of cookies (privacy policy).
close-image
close-link

Register now
close-link