Banner Table Software – Choosing the Right Software for Your Needs
Banner tables allow users to explore their survey results beyond what can be gleaned through simple crosstabs. It’s often useful to see how responses split over multiple response options and demographic groups. With banner tables, you can nest demographic groups and combine multiple questions to view their outputs simultaneously. This allows you to identify trends and insights that are lurking beneath the surface.
Banner Tables in Q
Q Research Software comes with state-of-the-art tools to provide you with the best possible analysis. Our software allows you to:
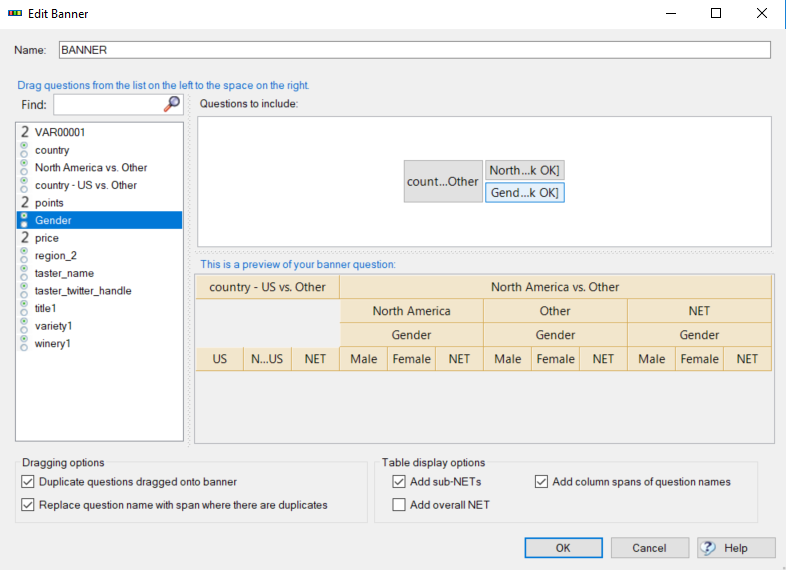
- Create banners by dragging and dropping: Simply click on the questions you want to include in your banner and drag them into the table — just like a crosstab.
- Create banners with R code: If you are looking to create a more complex banner table, you can get your hands dirty with some R code.
- Quickly and Easily modify existing banners: Add logic, edit logic, rename variables, and nest questions with ease.